集合(Ensemble)方法的目标是将不同的分类器组合到一起,相比每个单独的分类器具有更好的泛化性能。
算法描述
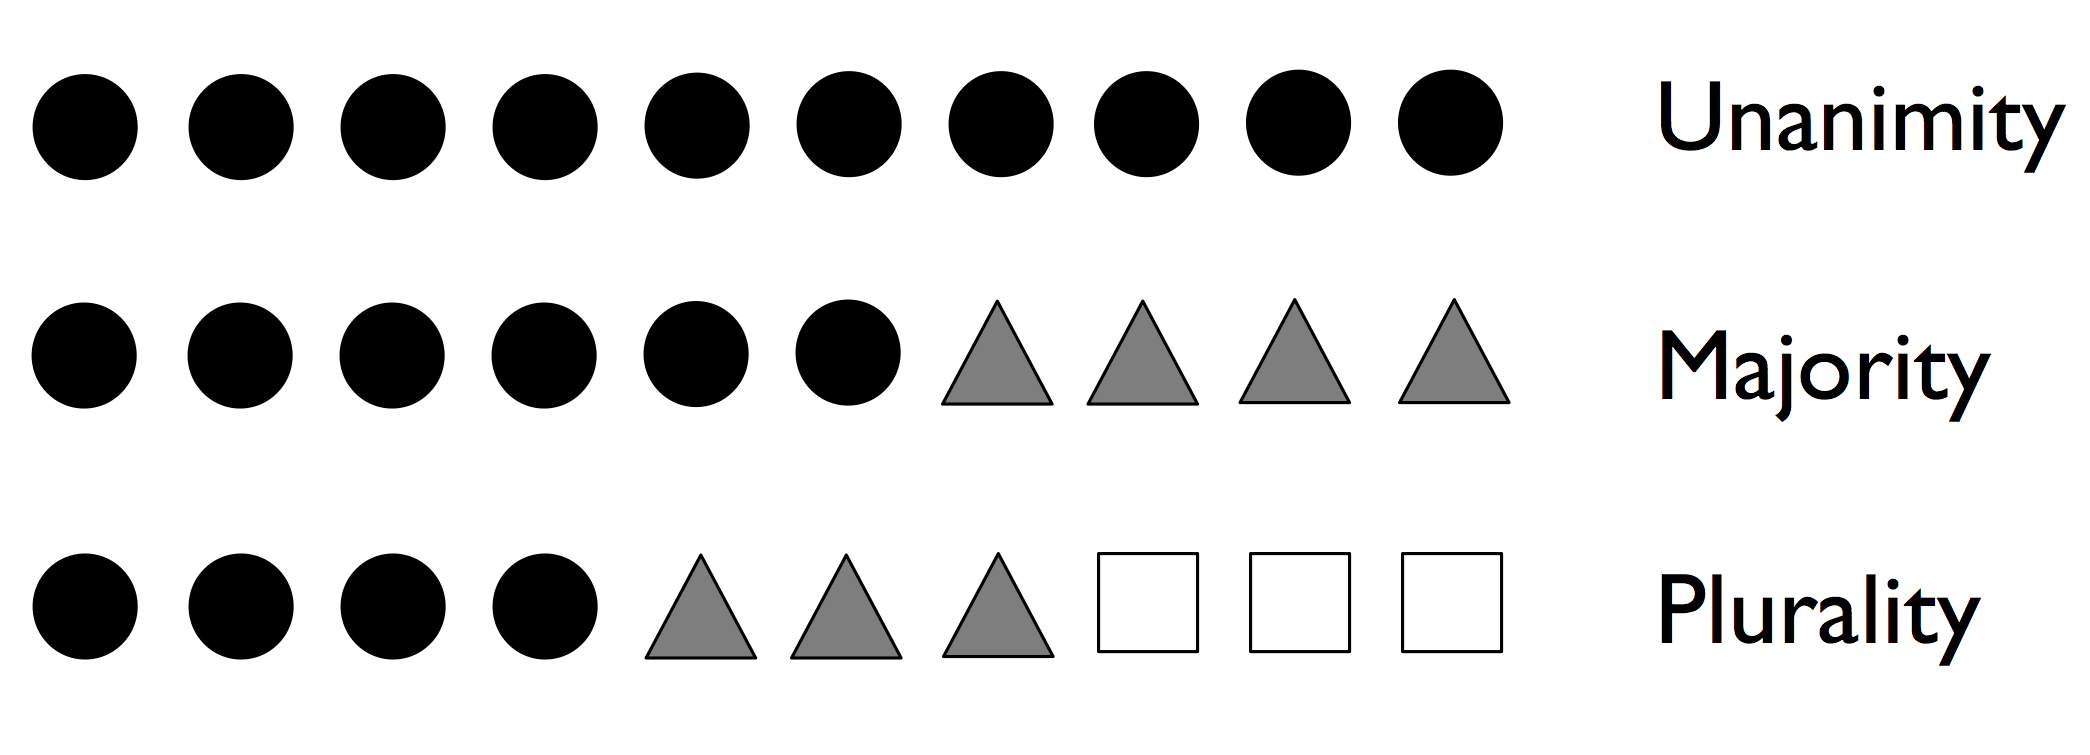
如果 10 位专家的预测分别如下,集合方法可以将其预测结果结合起来,从而得出比每位专家的预测更精确和更稳健的预测:
- 一致(Unanimity):预测情况一致
- 绝对多数投票(Majority Voting):预测情况不同,取高于 50% 的预测结果,适用于二元分类
- 相对多数投票(Plurality Voting):预测情况不同,取其中相对最高的预测结果,适用于多元分类
投票算法用于分类器时,可以取 m 个不同的分类器,然后使用不同的分类算法(决策树、SVM、逻辑回归等)构建集合;也可以使用相同的分类算法对不同的测试集进行评估。
以下为使用多数投票的集合方法实例,其中有 m 个分类器 $C_1, C_2, \cdots, C_m$ 以及其评估结果:
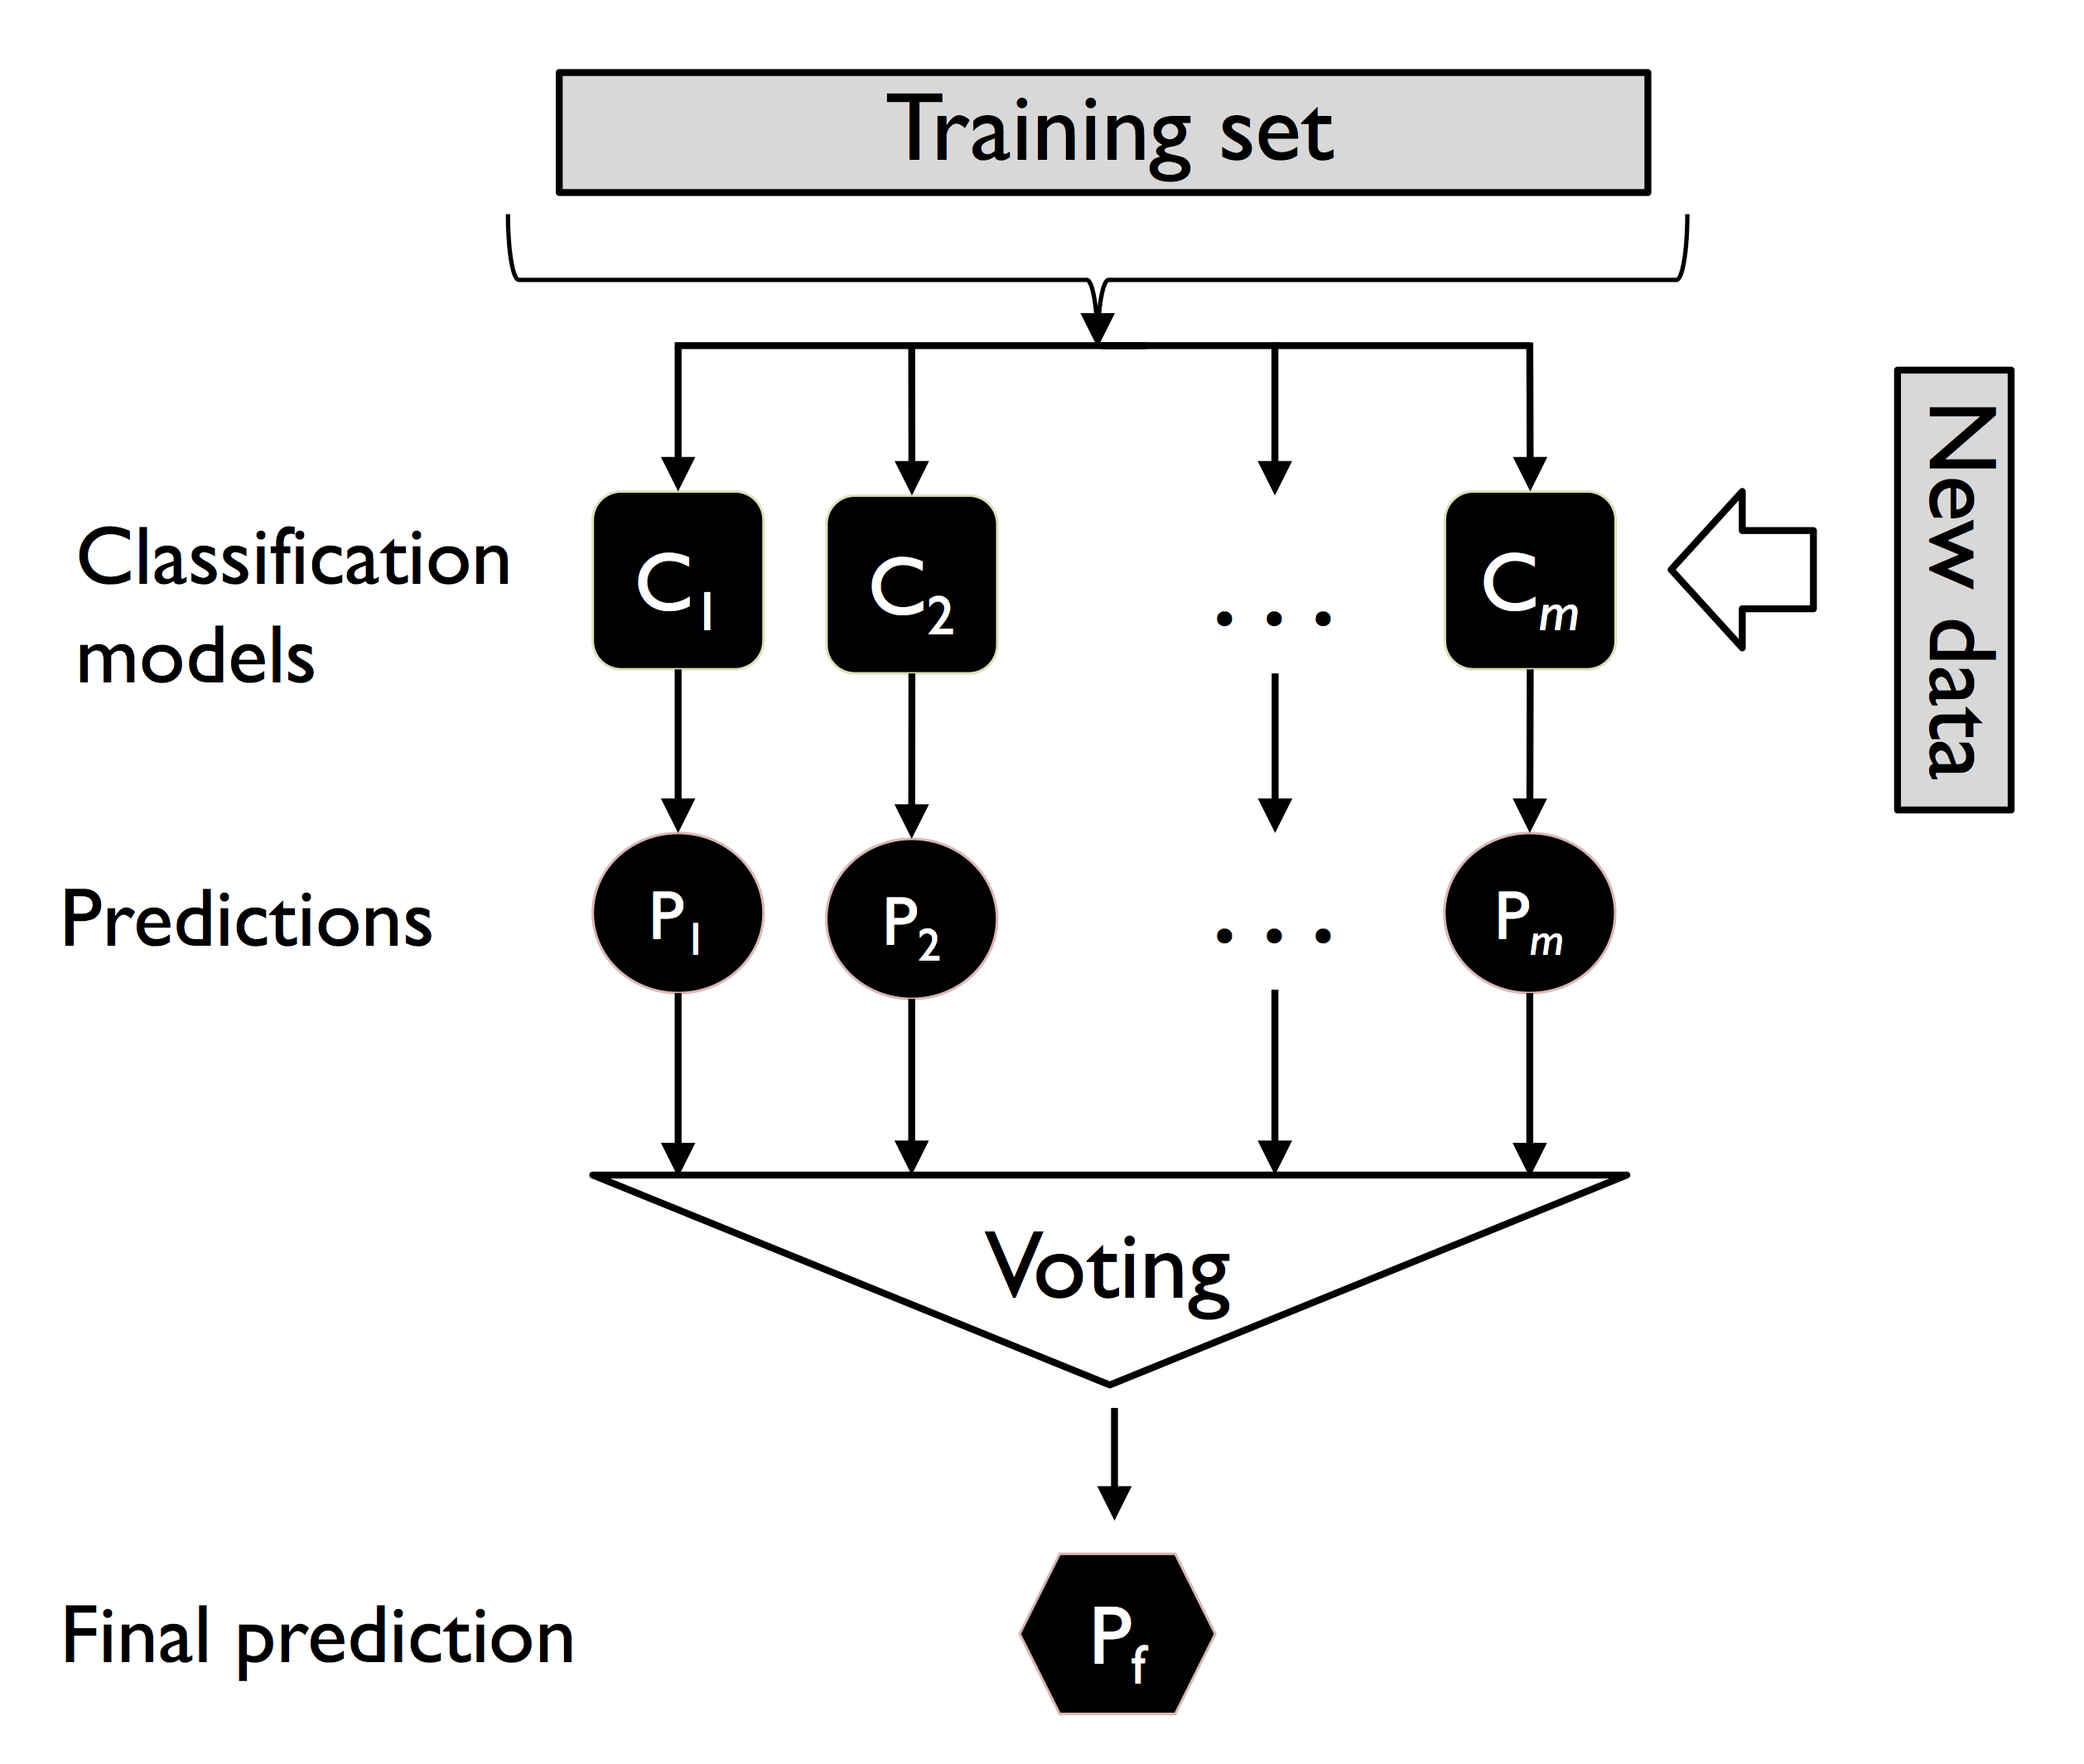
记 $\boldsymbol x$ 为输入,$\hat y$ 为预测的众数:
$$\begin{align} \hat y = mode \{C_1(\boldsymbol x), C_2(\boldsymbol x), \cdots, C_m(\boldsymbol x) \} \end{align}$$在统计学中,使用 $mode$ 代表众数,即出现次数最多的元素。
算法思想
接下来阐述为什么集合在绝大多数情况下能够比单个分类器具有更好的表现。
以二元分类为例,假设单个分类器的错误率 \varepsilon=0.25,使用 11 个分类器(假设其互不相关、且每个分类器的错误率相同)的集合错误率显著降低:
其中 $C_k^n$ 为二项式系数 $\cfrac {n!} {k!(n-k)!}$。
上述的数学表达式在 python 中实现如下:
1 | from scipy.misc import comb |
集合错误率和单个分类器错误率之前的关系绘图如下:
1 | import numpy as np |
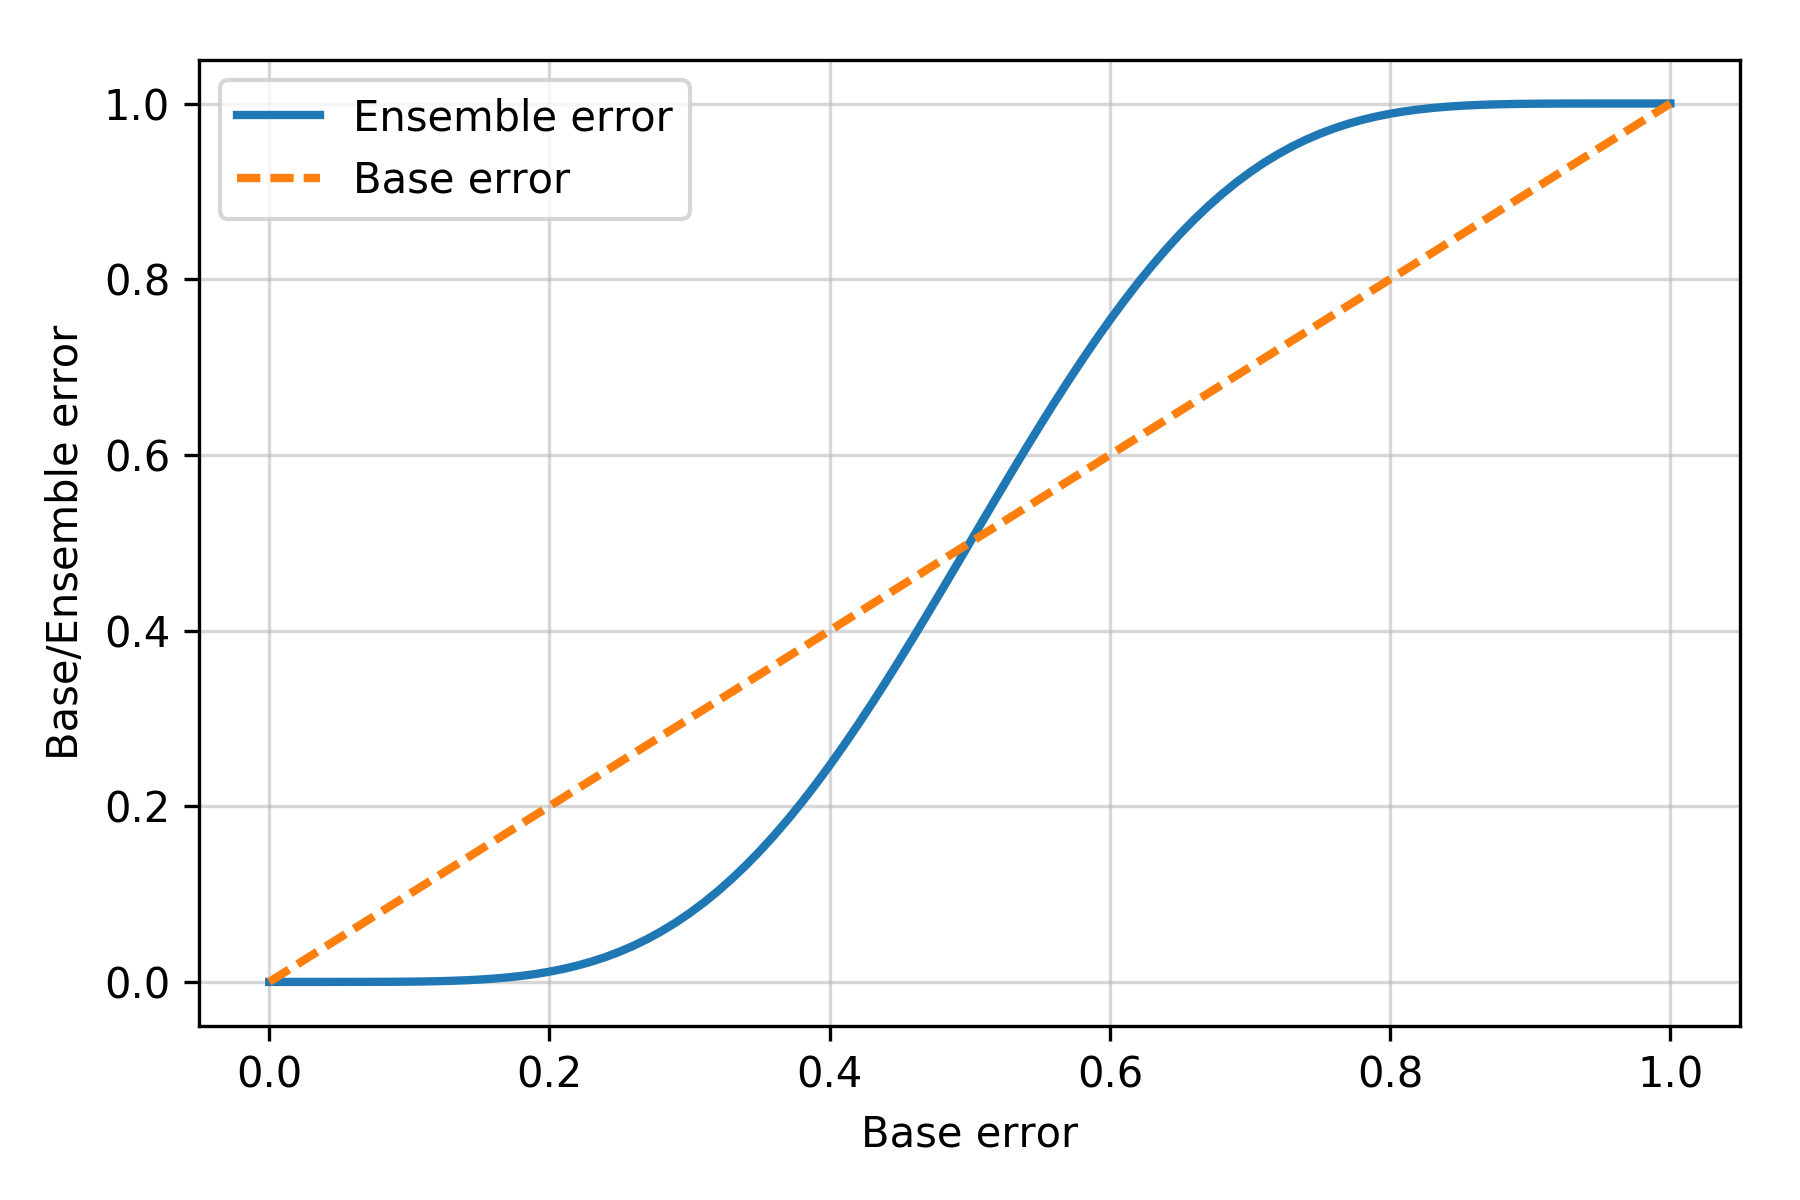
可以看的,只要单个分类器错误率小于 0.5(二元分类可以轻易达到这个水平),那么使用集合能够模型提高模型的预测能力。
加权相对多数分类器
加权相对多数分类器的结果如下,其中 $j$ 代表第 $j$ 个分类器,$i$ 代表类标签:
$$\begin{align} \hat y = \arg \max_i \sum_{j=1}^m w_j p_{ij} \end{align}$$为进行说明,假设有二元分类(类标签 $i$ 为 0 或 1),使用三个分类器的集合进行加权评估,每个分类器对于给定输入 $\boldsymbol x$ 的概率和权重如下:
- 第一个分类器预测为 0 和 1 和概率分别为 $C_1(\boldsymbol x) = [0.9, 0.1]$,权重为 0.2。
- 第二个分类器预测为 0 和 1 和概率分别为 $C_1(\boldsymbol x) = [0.8, 0.2]$,权重为 0.2。
- 第三个分类器预测为 0 和 1 和概率分别为 $C_1(\boldsymbol x) = [0.4, 0.6]$,权重为 0.6。
预测为类 0 和类 1 的概率分别为:
$$\begin{align} p(i = 0 \mid \boldsymbol x) & = 0.9 \times 0.2 + 0.8 \times 0.2 + 0.4 \times 0.2 = 0.58 \\ p(i = 1 \mid \boldsymbol x) & = 0.1 \times 0.2 + 0.2 \times 0.2 + 0.6 \times 0.2 = 0.42 \end{align}$$最终的预测分类为 0:
$$\begin{align} \hat y = \arg \max_i [p(i = 0 \mid \boldsymbol x), p(i = 1 \mid \boldsymbol x)] = 0 \end{align}$$1 | ex = np.array([[0.9, 0.1], |
scikit-learn 中实现了投票分类,请参见 sklearn.ensemble.VotingClassifier 。